"SafePeak acts like a transparent profiler and collects so much useful information, that allows our DBA and SW Architect groups to analyze it in an easy and intuitive way!"
SQL Performance Analytics and Real-time Monitoring
SafePeak provides a web-based GUI management dashboard for configuration, management and SQL analytics of all database traffic. The dashboard is used for many aspects of the SafePeak implementation and operation, including the following:
-
Configuration of SafePeak, with ability to manage multiple SQL Intances at once
-
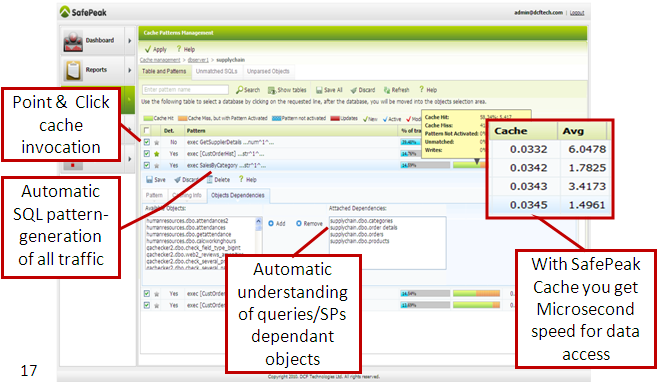
Configuration and optimization of SQL Patterns caching rules
-
Management of caching options such as time-to-live (TTL), Special Eviction Scheduling, SQL Pattern object dependencies for real-time dynamic cache eviction, Optimization of cache configuration of stored procedures, Overiding objects definition and configuration, daving configuration tempates - and many more features
-
Advanced real-time and historical SQL Performance Analytics and Monitoring
Performance Monitoring and SQL Analytics for DBAs and IT Managers
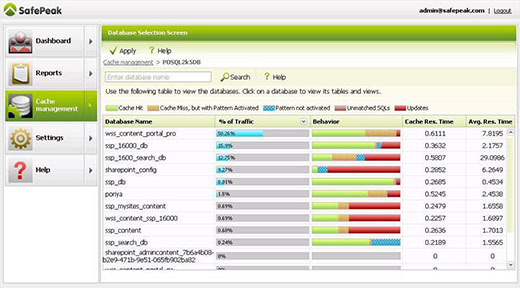
This information includes a full drill down on database instances regarding usage, usage information and performance execution time of queries, procedures, tables, views, databases and instances. Easily uncover the long running or frequently accessed queries, which can be fine tuned for better processing efficiency. The collected and analyzed data combines all executed SQL commands (and just samples), including queries and stored procedures.
Understand every object how it is used (like list of all possible SQL Queries Patterns that access a tables), how much it is used, what are its performance characteristicts (database average response time / speed , cache speed, total average speed), average cache misses, cache hits, times cache was locked or not activated, updates.
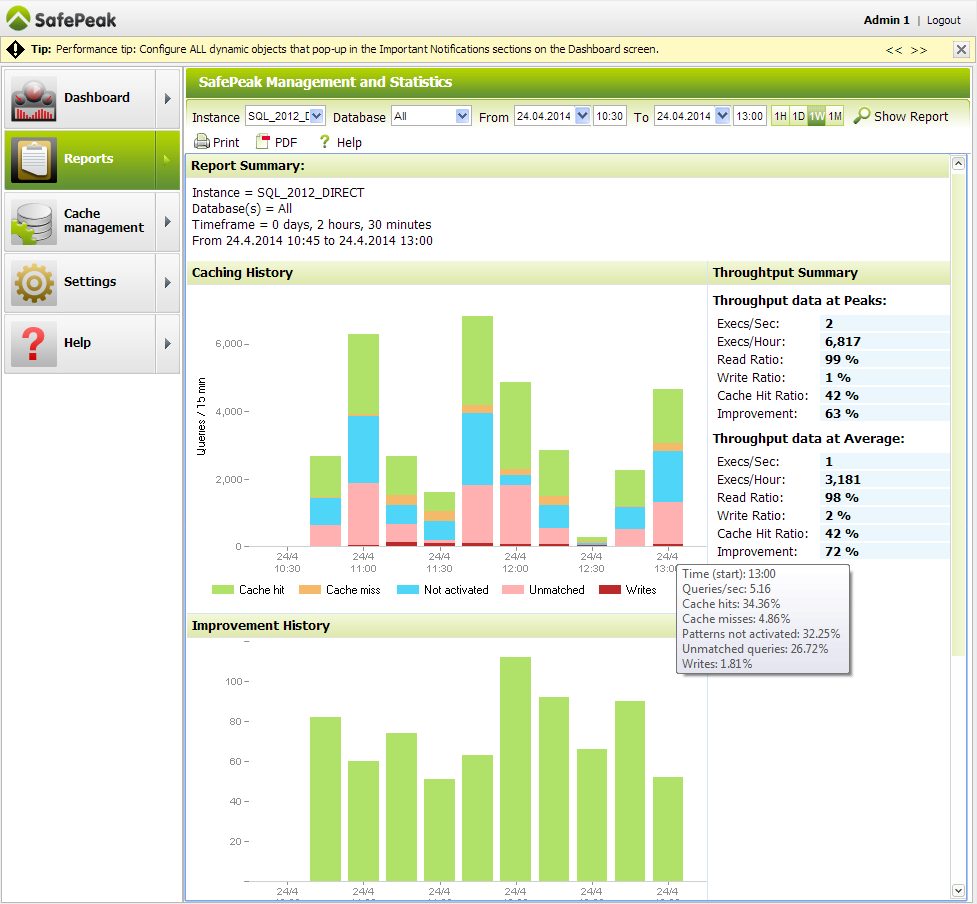
Find out what happened during certain hours at certain time frame, for example yesterday or last Wednesday.
-
What queries were called?
-
How much load was there compared to a normal day?
-
How efficient was caching?
-
What was the response time for all kinds of differnent queries, tables or databases?
-
Where were the bottlenecks?

Instances, databases, tables and patterns performance analysis

SafePeak monitoring dashboard

Performance and throughput reports